In this tutorial, we build MoodTrack , a full-stack mental health analytics dashboard using synthetic PHQ-9-like longitudinal data.
The system includes:
Python synthetic data generation
Node.js + Express backend API
SQLite database
React frontend dashboard
Prediction API
Deployment using Render and Netlify
This project is on a synthetic dataset.
1. Final Architecture
Synthetic PHQ-9 Data Generation
        ↓
SQLite Database
        ↓
Express Backend API
        ↓
Prediction Logic
        ↓
React Frontend Dashboard
        ↓
Deployment using Render + Netlify
Final project structure:
blog_mood_track/
├── backend/
│   ├── server.js
│   ├── package.json
│   ├── .env
│   ├── data/
│   │   ├── moodtrack_synthetic_phq9_dataset.csv
│   │   └── moodtrack_user_summary.csv
│   ├── db/
│   │   ├── database.js
│   │   ├── initDatabase.js
│   │   └── moodtrack.db
│   └── routes/
│       ├── users.js
│       ├── mood.js
│       ├── summary.js
│       └── prediction.js
├── frontend/
│   ├── .env
│   ├── package.json
│   └── src/
│       ├── App.js
│       ├── App.css
│       └── components/
│           ├── UserSelector.js
│           ├── MoodChart.js
│           ├── SummaryCards.js
│           └── PredictionCard.js
└── notebooks/
    └── moodtrack_fullstack_tutorial.ipynb
2. Synthetic PHQ-9 Data Generation
Real PHQ-9 data is sensitive and cannot be used publicly. Therefore, we generate synthetic longitudinal PHQ-9-like data.
The simulated dataset includes:
300 synthetic users
12 weekly observations per user
PHQ-9 scores from 0 to 27
trajectory patterns: stable, improving, worsening, relapse, fluctuating
extra variables: sleep, stress, activity, medication status
import numpy as npimport pandas as pd42 )= 300 = 12 = ["stable_low" ,"stable_moderate" ,"improving" ,"worsening" ,"relapse" ,"fluctuating" = [0.20 , 0.20 , 0.20 , 0.15 , 0.10 , 0.15 ]def phq9_category(score):if score <= 4 :return "minimal" elif score <= 9 :return "mild" elif score <= 14 :return "moderate" elif score <= 19 :return "moderately_severe" else :return "severe" = []for user_id in range (1 , n_users + 1 ):= int (np.clip(np.random.normal(38 , 12 ), 18 , 75 ))= np.random.choice(["female" , "male" ], p= [0.58 , 0.42 ])= np.random.choice(trajectory_types, p= trajectory_probs)= {"stable_low" : np.random.normal(4 , 2 ),"stable_moderate" : np.random.normal(12 , 3 ),"improving" : np.random.normal(17 , 4 ),"worsening" : np.random.normal(6 , 3 ),"relapse" : np.random.normal(9 , 3 ),"fluctuating" : np.random.normal(11 , 4 ),for week in range (1 , n_weeks + 1 ):= np.random.normal(0 , 1.8 )if trajectory == "stable_low" := baseline + noiseelif trajectory == "stable_moderate" := baseline + noiseelif trajectory == "improving" := baseline - (week - 1 ) * np.random.uniform(0.7 , 1.2 ) + noiseelif trajectory == "worsening" := baseline + (week - 1 ) * np.random.uniform(0.6 , 1.1 ) + noiseelif trajectory == "relapse" :if week <= 6 := baseline - week * np.random.uniform(0.4 , 0.9 ) + noiseelse := baseline - 4 + (week - 6 ) * np.random.uniform(1.0 , 1.7 ) + noiseelse := baseline + 4 * np.sin(week / 1.5 ) + noise= int (np.clip(round (score), 0 , 27 ))"user_id" : f"U { user_id:04d} " ,"week" : week,"age" : age,"sex" : sex,"trajectory_type" : trajectory,"phq9_score" : score,"phq9_category" : phq9_category(score),"sleep_hours" : round (np.clip(np.random.normal(7 - score * 0.08 , 1.0 ), 3 , 10 ), 1 ),"physical_activity_days" : int (np.clip(round (np.random.normal(4 - score * 0.12 , 1.5 )), 0 , 7 )),"stress_level" : int (np.clip(round (np.random.normal(3 + score * 0.22 , 1.3 )), 1 , 10 )),"medication_status" : np.random.choice(["none" , "started" , "ongoing" ], p= [0.55 , 0.15 , 0.30 ])= pd.DataFrame(records)"high_risk_flag" ] = df["phq9_score" ] >= 15 "created_at" ] = pd.Timestamp("2026-01-01" ) + pd.to_timedelta((df["week" ] - 1 ) * 7 , unit= "D" )
0
U0001
1
43
male
improving
17
moderately_severe
5.1
1
3
none
True
2026-01-01
1
U0001
2
43
male
improving
17
moderately_severe
5.2
1
6
ongoing
True
2026-01-08
2
U0001
3
43
male
improving
11
moderate
8.7
3
6
none
False
2026-01-15
3
U0001
4
43
male
improving
13
moderate
5.4
4
6
none
False
2026-01-22
4
U0001
5
43
male
improving
12
moderate
5.5
3
5
started
False
2026-01-29
= ("user_id" )= ("age" , "first" ),= ("sex" , "first" ),= ("trajectory_type" , "first" ),= ("phq9_score" , "first" ),= ("phq9_score" , "last" ),= ("phq9_score" , "mean" ),= ("phq9_score" , "max" ),= ("phq9_score" , "min" ),= ("high_risk_flag" , "sum" )"change_from_baseline" ] = summary["final_score" ] - summary["baseline_score" ]"moodtrack_synthetic_phq9_dataset.csv" , index= False )"moodtrack_user_summary.csv" , index= False )print (df.shape)print (summary.shape)
0
U0001
43
male
improving
17
6
11.500000
17
6
2
-11
1
U0002
50
male
stable_moderate
9
11
10.750000
14
9
0
2
2
U0003
28
male
fluctuating
7
9
5.666667
10
0
0
2
3
U0004
38
male
worsening
9
16
10.833333
16
7
2
7
4
U0005
36
male
fluctuating
13
12
9.916667
14
5
0
-1
After generating the data, copy both CSV files into the backend data folder:
mkdir -p backend/datacp moodtrack_synthetic_phq9_dataset.csv backend/data/cp moodtrack_user_summary.csv backend/data/
3. Exploratory Data Analysis
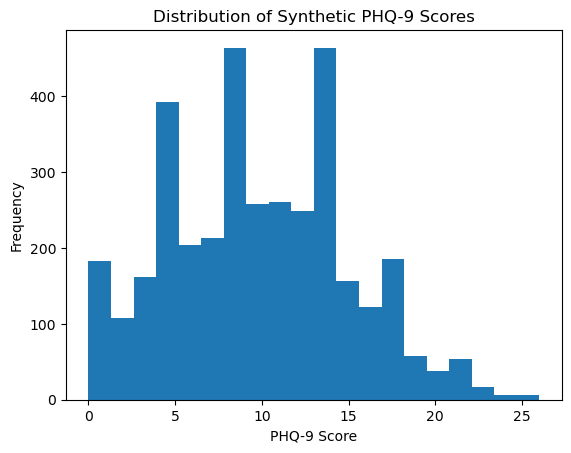
Before building the application, we inspect the generated data to understand the PHQ-9 score distribution and example trajectories.
import matplotlib.pyplot as plt"phq9_score" ], bins= 20 )"PHQ-9 Score" )"Frequency" )"Distribution of Synthetic PHQ-9 Scores" )
= df["user_id" ].unique()[:5 ]for user in sample_users:= df[df["user_id" ] == user]"week" ], temp["phq9_score" ], marker= "o" , label= user)"Week" )"PHQ-9 Score" )"Sample Mood Trajectories" )
4. Backend Setup
The backend is built using Node.js and Express .
Create the backend folder and initialize the project.
mkdir backendcd backendnpm init -y npm install express cors csv-parser dotenv sqlite sqlite3npm install --save-dev nodemonCreate folders and files:
mkdir datamkdir routesmkdir dbtouch server.jstouch .envtouch routes/users.jstouch routes/mood.jstouch routes/summary.jstouch routes/prediction.jstouch db/database.jstouch db/initDatabase.jsAdd this to backend/.env
PORT=5000
5. Backend package.json
Replace the automatically generated backend/package.json with the following:
{ "name" : "moodtrack-backend" ,"version" : "1.0.0" ,"main" : "server.js" ,"scripts" : {"start" : "node server.js" ,"dev" : "nodemon server.js" }, "dependencies" : {"cors" : "^2.8.5" ,"csv-parser" : "^3.2.0" ,"dotenv" : "^16.4.7" ,"express" : "^5.1.0" ,"sqlite" : "^5.1.1" ,"sqlite3" : "^5.1.7" }, "devDependencies" : {"nodemon" : "^3.1.10" } }
6. SQLite Database Connection
We now create the SQLite connection layer.
const sqlite3 = require( "sqlite3" ); const { open } = require( "sqlite" ); const path = require( "path" ); async function openDatabase( ) { return open ( { filename: path.join( __dirname, "moodtrack.db" ) , driver: sqlite3.Database}); } module.exports = openDatabase;
7. Initialize SQLite Database
This script:
creates tables
reads CSV files
inserts data into SQLite
backend/db/initDatabase.js
const fs = require("fs");
const csv = require("csv-parser");
const path = require("path");
const openDatabase = require("./database");

function loadCSV(filePath) {
  return new Promise((resolve, reject) => {
    const results = [];

    fs.createReadStream(filePath)
      .pipe(csv())
      .on("data", (row) => results.push(row))
      .on("end", () => resolve(results))
      .on("error", (err) => reject(err));
  });
}

async function initDatabase() {
  const db = await openDatabase();

  await db.exec(`
    DROP TABLE IF EXISTS mood_records;
    DROP TABLE IF EXISTS user_summary;

    CREATE TABLE mood_records (
      id INTEGER PRIMARY KEY AUTOINCREMENT,
      user_id TEXT,
      week INTEGER,
      age INTEGER,
      sex TEXT,
      trajectory_type TEXT,
      phq9_score INTEGER,
      phq9_category TEXT,
      sleep_hours REAL,
      physical_activity_days INTEGER,
      stress_level INTEGER,
      medication_status TEXT,
      high_risk_flag TEXT,
      created_at TEXT
    );

    CREATE TABLE user_summary (
      user_id TEXT PRIMARY KEY,
      age INTEGER,
      sex TEXT,
      trajectory_type TEXT,
      baseline_score INTEGER,
      final_score INTEGER,
      mean_score REAL,
      max_score INTEGER,
      min_score INTEGER,
      high_risk_weeks INTEGER,
      change_from_baseline INTEGER
    );
  `);

  const moodData = await loadCSV(
    path.join(__dirname, "..", "data", "moodtrack_synthetic_phq9_dataset.csv")
  );

  const summaryData = await loadCSV(
    path.join(__dirname, "..", "data", "moodtrack_user_summary.csv")
  );

  for (const row of moodData) {
    await db.run(
      `
      INSERT INTO mood_records (
        user_id, week, age, sex, trajectory_type, phq9_score,
        phq9_category, sleep_hours, physical_activity_days,
        stress_level, medication_status, high_risk_flag, created_at
      )
      VALUES (?, ?, ?, ?, ?, ?, ?, ?, ?, ?, ?, ?, ?)
      `,
      [
        row.user_id,
        Number(row.week),
        Number(row.age),
        row.sex,
        row.trajectory_type,
        Number(row.phq9_score),
        row.phq9_category,
        Number(row.sleep_hours),
        Number(row.physical_activity_days),
        Number(row.stress_level),
        row.medication_status,
        row.high_risk_flag,
        row.created_at
      ]
    );
  }

  for (const row of summaryData) {
    await db.run(
      `
      INSERT INTO user_summary (
        user_id, age, sex, trajectory_type, baseline_score,
        final_score, mean_score, max_score, min_score,
        high_risk_weeks, change_from_baseline
      )
      VALUES (?, ?, ?, ?, ?, ?, ?, ?, ?, ?, ?)
      `,
      [
        row.user_id,
        Number(row.age),
        row.sex,
        row.trajectory_type,
        Number(row.baseline_score),
        Number(row.final_score),
        Number(row.mean_score),
        Number(row.max_score),
        Number(row.min_score),
        Number(row.high_risk_weeks),
        Number(row.change_from_baseline)
      ]
    );
  }

  console.log("SQLite database initialized successfully.");
  console.log("Mood records inserted:", moodData.length);
  console.log("Summary records inserted:", summaryData.length);

  await db.close();
}

initDatabase();
Run the initialization script:
cd backendnode db/initDatabase.jsExpected output:
SQLite database initialized successfully.Mood records inserted: 3600Summary records inserted: 300
8. Backend Route Files
The backend exposes multiple REST API endpoints.
backend/routes/users.js
const express = require( "express" ); const router = express.Router( ); module.exports = function ( db ) { router.get ( "/" , async ( req, res) = > {try {const users = await db.all( "SELECT DISTINCT user_id FROM mood_records ORDER BY user_id" ); res.json ( users.map (( row ) = > row.user_id)); } catch ( error ) { res.status ( 500 ) .json ( { error: error.message }) ; } } ); return router ; };
backend/routes/mood.js
const express = require( "express" ); const router = express.Router( ); module.exports = function ( db ) { router.get ( "/" , async ( req, res) = > {try {const rows = await db.all( "SELECT * FROM mood_records" ); res.json ( rows ); } catch ( error ) { res.status ( 500 ) .json ( { error: error.message }) ; } } ); router.get ( "/:user_id" , async ( req, res) = > {try {const rows = await db.all( "SELECT * FROM mood_records WHERE user_id = ? ORDER BY week" , [req.params.user_id] ); if ( rows.length === 0) { return res.status ( 404 ) .json ( { error: "User not found" }) ; } res.json ( rows ); } catch ( error ) { res.status ( 500 ) .json ( { error: error.message }) ; } } ); return router ; };
backend/routes/summary.js
const express = require( "express" ); const router = express.Router( ); module.exports = function ( db ) { router.get ( "/" , async ( req, res) = > {try {const rows = await db.all( "SELECT * FROM user_summary ORDER BY user_id" ); res.json ( rows ); } catch ( error ) { res.status ( 500 ) .json ( { error: error.message }) ; } } ); return router ; };
Part 3: Prediction API + Backend Server + Local Backend Test
9. Prediction API
To add a simple machine learning-style component, we create a prediction endpoint.
The model uses a simple linear trend over the user’s PHQ-9 trajectory to estimate the next week’s PHQ-9 score.
This is not intended as a clinical model. It is used to demonstrate how predictive logic can be exposed through an API.
backend/routes/prediction.js
const express = require( "express" ); const router = express.Router( ); function linearRegression ( data ) { const n = data.length; const sumX = data.reduce( ( sum , row) = > sum + row.week, 0); const sumY = data.reduce( ( sum , row) = > sum + row.phq9_score, 0); const sumXY = data.reduce( ( sum , row) = > sum + row.week * row.phq9_score, 0); const sumX2 = data.reduce( ( sum , row) = > sum + row.week * row.week, 0); const slope =( n * sumXY - sumX * sumY) / ( n * sumX2 - sumX * sumX); const intercept = ( sumY - slope * sumX) / n; return { slope, intercept }; } module.exports = function ( db ) { router.get ( "/:user_id" , async ( req, res) = > {try {const rows = await db.all( "SELECT week, phq9_score FROM mood_records WHERE user_id = ? ORDER BY week" , [req.params.user_id] ); if ( rows.length === 0) { return res.status ( 404 ) .json ( { error: "User not found" }) ; } const data = rows.map( ( row ) = > ( { week: Number( row.week ) , phq9_score: Number( row.phq9_score ) })); const { slope, intercept } = linearRegression( data ); const nextWeek = Math.max( ...data.map (( row ) = > row.week)) + 1; let predictedScore = slope * nextWeek + intercept ; predictedScore = Math.round( Math.max ( 0, Math.min( 27, predictedScore))); let riskLevel = "low" ; if ( predictedScore > = 15) { riskLevel = "high" ; } else if ( predictedScore > = 10) { riskLevel = "moderate" ; } res.json ( { user_id: req.params.user_id,next_week: nextWeek,predicted_phq9_score: predictedScore,trend_slope: Number( slope.toFixed ( 2 )) , risk_level: riskLevel}); } catch ( error ) { res.status ( 500 ) .json ( { error: error.message }) ; } } ); return router ; };
10. Backend Server
Now we connect the database and all route files in the main backend server.
backend/server.js
const express = require( "express" ); const cors = require( "cors" ); require ( "dotenv" ) .config() ; const openDatabase = require( "./db/database" ); const usersRouter = require( "./routes/users" ); const moodRouter = require( "./routes/mood" ); const summaryRouter = require( "./routes/summary" ); const predictionRouter = require( "./routes/prediction" ); const app = express( ); const PORT = process.env.PORT || 5000 ; app.use ( cors() ); app.use ( express.json() ); async function startServer( ) { try {const db = await openDatabase( ); app.get ( "/" , ( req, res) = > {res.json ( { status: "OK" ,message: "MoodTrack backend is live" }); } ); app.get ( "/api/health" , ( req, res) = > {res.json ( { status: "OK" ,message: "MoodTrack API is running with SQLite" }); } ); app.use ( "/api/users" , usersRouter( db )); app.use ( "/api/mood" , moodRouter( db )); app.use ( "/api/summary" , summaryRouter( db )); app.use ( "/api/prediction" , predictionRouter( db )); app.listen ( PORT, () = > {console.log ( "MoodTrack API running on port " + PORT); console.log ( "Connected to SQLite database" ); } ); } catch ( error ) { console.error ( "Failed to start server:" , error); } } startServer() ;
11. Running the Backend Locally
Start the backend server:
Expected terminal output:
MoodTrack API running on port 5000
Connected to SQLite database
Test the following API endpoints in the browser:
http://localhost:5000/
http://localhost:5000/api/health
http://localhost:5000/api/users
http://localhost:5000/api/mood/U0001
http://localhost:5000/api/summary
http://localhost:5000/api/prediction/U0001
Example prediction output:
{ "user_id" : "U0001" ,"next_week" : 13,"predicted_phq9_score" : 8,"trend_slope" : -0.35, "risk_level" : "low" } At this stage, we have a working backend API connected to a SQLite database.
12. React Frontend Setup
Next, we create the React frontend.
The frontend will:
fetch users from the backend
allow user selection
show PHQ-9 trajectory
display summary statistics
show prediction output
npx create-react-app frontendcd frontendnpm install axios rechartsCreate the frontend environment file:
Add this to frontend/.env:
REACT_APP_API_URL=http://localhost:5000
Create component files:
cd srcmkdir componentsvim components/UserSelector.jsvim components/MoodChart.jsvim components/SummaryCards.jsvim components/PredictionCard.js
13. Frontend Components
frontend/src/components/UserSelector.js
function UserSelector ({ users , selectedUser, onUserChange }) { return ( < div className = "card" > < h2> Select User < /h2> < selectvalue = {selectedUser}onChange = {( e ) = > onUserChange( e.target.value ) } > {users.map (( user ) = > ( < option key = {user} value = {user}> {user} < /option> )) } < /select> < /div> ); } export default UserSelector ;
frontend/src/components/MoodChart.js
import {LineChart, Line, XAxis, YAxis, CartesianGrid, Tooltip, ResponsiveContainer } from "recharts" ; function MoodChart ({ moodData }) { return ( < div className = "card" > < h2> PHQ-9 Score Over Time< /h2> < ResponsiveContainer width = "100%" height = {350}> < LineChart data = {moodData}> < CartesianGrid strokeDasharray = "3 3" / > < XAxis dataKey = "week" / > < YAxis domain = {[0, 27]} /> < Tooltip / > < Linetype = "monotone" dataKey = "phq9_score" strokeWidth = {3}/ > < /LineChart> < /ResponsiveContainer> < /div> ); } export default MoodChart ;
frontend/src/components/SummaryCards.js
function SummaryCards ({ selectedUser, summaryData }) { const userSummary = summaryData.find( ( row ) = > row.user_id === selectedUser); if ( !userSummary ) { return null ; } return ( < div className = "summary-grid" > < div className = "summary-card" > < h3> Baseline Score < /h3> < p> {userSummary.baseline_score}< /p> < /div> < div className = "summary-card" > < h3> Final Score < /h3> < p> {userSummary.final_score}< /p> < /div> < div className = "summary-card" > < h3> Mean Score < /h3> < p> {Number(userSummary.mean_score).toFixed(1)}< /p> < /div> < div className = "summary-card" > < h3> High-Risk Weeks < /h3> < p> {userSummary.high_risk_weeks}< /p> < /div> < /div> ); } export default SummaryCards ;
frontend/src/components/PredictionCard.js
function PredictionCard ({ prediction }) { if ( !prediction ) { return null ; } return ( < div className = "prediction-card" > < h2> Next Week Prediction< /h2> < p> Predicted PHQ-9 score for week {prediction.next_week}:< strong> {prediction.predicted_phq9_score}< /strong> < /p> < p> Trend slope:< strong> {prediction.trend_slope}< /strong> < /p> < p> Risk level:< strong> {prediction.risk_level}< /strong> < /p> < /div> ); } export default PredictionCard ;
14. Frontend App.js
The main React app connects all components together.
It fetches:
user IDs from /api/users
summary data from /api/summary
selected user trajectory from /api/mood/:user_id
prediction output from /api/prediction/:user_id
frontend/src/App.js
import React, { useEffect, useState } from "react" ; import axios from "axios" ; import "./App.css" ; import UserSelector from "./components/UserSelector" ; import MoodChart from "./components/MoodChart" ; import SummaryCards from "./components/SummaryCards" ; import PredictionCard from "./components/PredictionCard" ; const API_URL = process.env.REACT_APP_API_URL; function App() { const [users, setUsers] = useState( [] ); const [selectedUser, setSelectedUser] = useState( "" ); const [moodData, setMoodData] = useState( [] ); const [summaryData, setSummaryData] = useState( [] ); const [prediction, setPrediction] = useState( null ); useEffect (( ) = > {axios .get ( API_URL + "/api/users" ) .then (( res ) = > {setUsers ( res.data ); setSelectedUser ( res.data[0] ); } ) .catch (( err ) = > console.error( "Error fetching users:" , err)); axios .get ( API_URL + "/api/summary" ) .then (( res ) = > {setSummaryData ( res.data ); } ) .catch (( err ) = > console.error( "Error fetching summary:" , err)); } , []); useEffect (( ) = > {if ( selectedUser ) { axios .get ( API_URL + "/api/mood/" + selectedUser) .then (( res ) = > {const cleanedData = res.data.map( ( row ) = > ( { week: Number( row.week ) , phq9_score: Number( row.phq9_score ) })); setMoodData ( cleanedData ); } ) .catch (( err ) = > console.error( "Error fetching mood data:" , err)); axios .get ( API_URL + "/api/prediction/" + selectedUser) .then (( res ) = > {setPrediction ( res.data ); } ) .catch (( err ) = > console.error( "Error fetching prediction:" , err)); } } , [ selectedUser ] ); return ( < div className = "App" > < header className = "header" > < h1> MoodTrack Dashboard < /h1> < p> Visualizing synthetic PHQ-9 trajectories with predictive insights< /p> < /header> < main className = "container" > < UserSelectorusers = {users}selectedUser = {selectedUser}onUserChange = {setSelectedUser}/ > < SummaryCardsselectedUser = {selectedUser}summaryData = {summaryData}/ > < PredictionCard prediction = {prediction} / > < MoodChart moodData = {moodData} / > < /main> < /div> ); } export default App ;
15. Frontend Styling
The CSS file gives the dashboard a clean card-based layout.
frontend/src/App.css
.App {font-family: Arial, sans-serif; background: #f5f7fb; min-height: 100vh; } .header {background: #253858; color: white; padding: 30px; text-align: center; } .header h1 {margin: 0; font-size: 36px; } .header p {margin-top: 10px; font-size: 16px; } .container {max-width: 1000px; margin: 30px auto; padding: 20px; } .card {background: white; padding: 25px; margin-bottom: 25px; border-radius: 12px; box-shadow: 0 4px 12px rgba( 0,0,0,0.08 ); } .card h2 {margin-top: 0; } select { padding: 10px; font-size: 16px; width: 200px; } .summary-grid {display: grid; grid-template-columns: repeat( 4, 1fr); gap: 20px; margin-bottom: 25px; } .summary-card {background: white; padding: 20px; border-radius: 12px; text-align: center; box-shadow: 0 4px 12px rgba( 0,0,0,0.08 ); } .summary-card h3 {margin: 0; font-size: 16px; } .summary-card p {font-size: 28px; font-weight: bold; margin: 10px 0 0; } .prediction-card {background: white; padding: 25px; margin-bottom: 25px; border-radius: 12px; box-shadow: 0 4px 12px rgba( 0,0,0,0.08 ); } .prediction-card h2 {margin-top: 0; } .prediction-card strong {font-size: 20px; }
16. Running the Full Application Locally
The application has two parts:
Backend API
React frontend
Both must run at the same time.
Terminal 1 — Start Backend
Expected backend output:
MoodTrack API running on port 5000Connected to SQLite database
Terminal 2 — Start Frontend
cd frontendunset HOST npm startOpen the frontend in your browser:
If React says port 3000 is already in use, press Y to use another port.
At this point, the dashboard should show:
user dropdown
PHQ-9 trajectory plot
summary cards
prediction card
17. Deployment
After confirming that the application works locally, we deploy it using free hosting platforms.
The deployment architecture is:
React Frontend  →  Netlify
Express Backend →  Render
SQLite Database →  included in backend deployment
This gives us a publicly accessible full-stack data science application.
18. Deploy Backend on Render
The backend is deployed as a Render Web Service.
Before deployment, make sure the backend has:
server.jspackage.jsonroutes/db/moodtrack.dbdb/database.jsdb/initDatabase.js
Render settings:
Root Directory: backend
Build Command: npm install
Start Command: npm start
Instance Type: Free
After deployment, Render provides a backend URL such as:
https://moodtrack-backend.onrender.comTest the deployed backend:
https://moodtrack-backend.onrender.com/
https://moodtrack-backend.onrender.com/api/health
Expected output:
{
  "status": "OK",
  "message": "MoodTrack API is running with SQLite"
}
19. Deploy Frontend on Netlify
The React frontend is deployed using Netlify.
Netlify settings:
Base directory: frontend
Build command: npm run build
Publish directory: build
Add this environment variable in Netlify:
REACT_APP_API_URL=https://moodtrack-backend.onrender.comThis tells the deployed frontend to call the deployed backend API instead of the local backend.
After deployment, Netlify provides a live frontend URL such as:
https://your-site-name.netlify.app
20. Final Application Output
The deployed MoodTrack dashboard includes:
A user selector
PHQ-9 trajectory visualization
Baseline score
Final score
Mean score
High-risk week count
Next-week PHQ-9 prediction
Risk classification
Live links:
Frontend: YOUR_NETLIFY_LINK
Backend: https://moodtrack-backend.onrender.com
Replace YOUR_NETLIFY_LINK with your actual deployed Netlify link.
22. What We Built
In this project, we built a complete full-stack analytics system:
Synthetic PHQ-9 Data
        ↓
SQLite Database
        ↓
Express REST API
        ↓
Prediction Endpoint
        ↓
React Dashboard
        ↓
Cloud Deployment
This demonstrates how a data science workflow can be transformed into a deployable application.
23. Key Learning Outcomes
This project covers:
synthetic data generation
longitudinal PHQ-9 trajectory simulation
exploratory visualization
backend API development
REST API design
SQLite database integration
modular backend route structure
React frontend component design
charting with Recharts
environment variable configuration
simple predictive modeling
deployment using Render and Netlify
24. Limitations
This project has important limitations:
The dataset is synthetic and does not represent real patients.
The prediction model is a simple linear trend model.
The system is not clinically validated.
There is no authentication or user-level privacy layer.
SQLite is suitable for demonstration, but not ideal for production-scale deployment.
Render free services may sleep after inactivity, so the first request may be slow.
This project should be understood as an educational full-stack data science demonstration, not a medical device or clinical decision-support tool.
25. Future Work
Future improvements could include:
replacing SQLite with PostgreSQL or Azure SQL
adding user authentication
adding role-based access control
improving the ML model
adding relapse detection
adding anomaly detection
creating population-level analytics
deploying a production version on Azure
adding logging and monitoring
adding automated tests
26. Azure Extension
The current free deployment uses:
Frontend: Netlify
Backend: Render
Database: SQLite
A production Azure version could use:
Frontend: Azure Static Web Apps
Backend: Azure App Service
Database: Azure SQL Database
The conceptual architecture remains the same:
React Frontend → Backend API → DatabaseThe main difference is that Azure SQL would replace the local SQLite file with a managed cloud database.
27. Conclusion
In this tutorial, we built and deployed MoodTrack, a full-stack mental health analytics dashboard using synthetic PHQ-9 data.
The project demonstrates how data science, backend engineering, frontend visualization, predictive modeling, and deployment can be combined into a single end-to-end application.
This project is useful as a portfolio project because it shows not only analysis, but also the ability to turn analytical work into an interactive, deployable product.